Zeabur Dashboard
Project cards as status summaries, project details as a standalone page; rebuilt the design system and shipped light mode
- 2024.04 – 2025.03
- Design Engineer
Project cards as status summaries, project details as a standalone page; rebuilt the design system and shipped light mode
Zeabur (pronounced /ˈziːˌbər/) is a PaaS that lets developers deploy frontends, backends and databases in one click. As the sole designer on a small, fast-shipping startup team, I owned the interface, design system and brand visuals across the dashboard and website, and shipped components and pages directly in frontend code.
12
Months on the team
552
Commits to the dashboard repository, excluding merges
189
Commits to the website repository, excluding merges
Before the redesign, a project card showed only its name and an eight-slot grid of service icons, padded with empty slots and ending with an add button. It worked more like an entry point for adding services than an overview—telling users nothing about the project's region, health or cost without opening each one.
Of the eight slots on a card, three are services, one is the add button, and the rest are placeholders
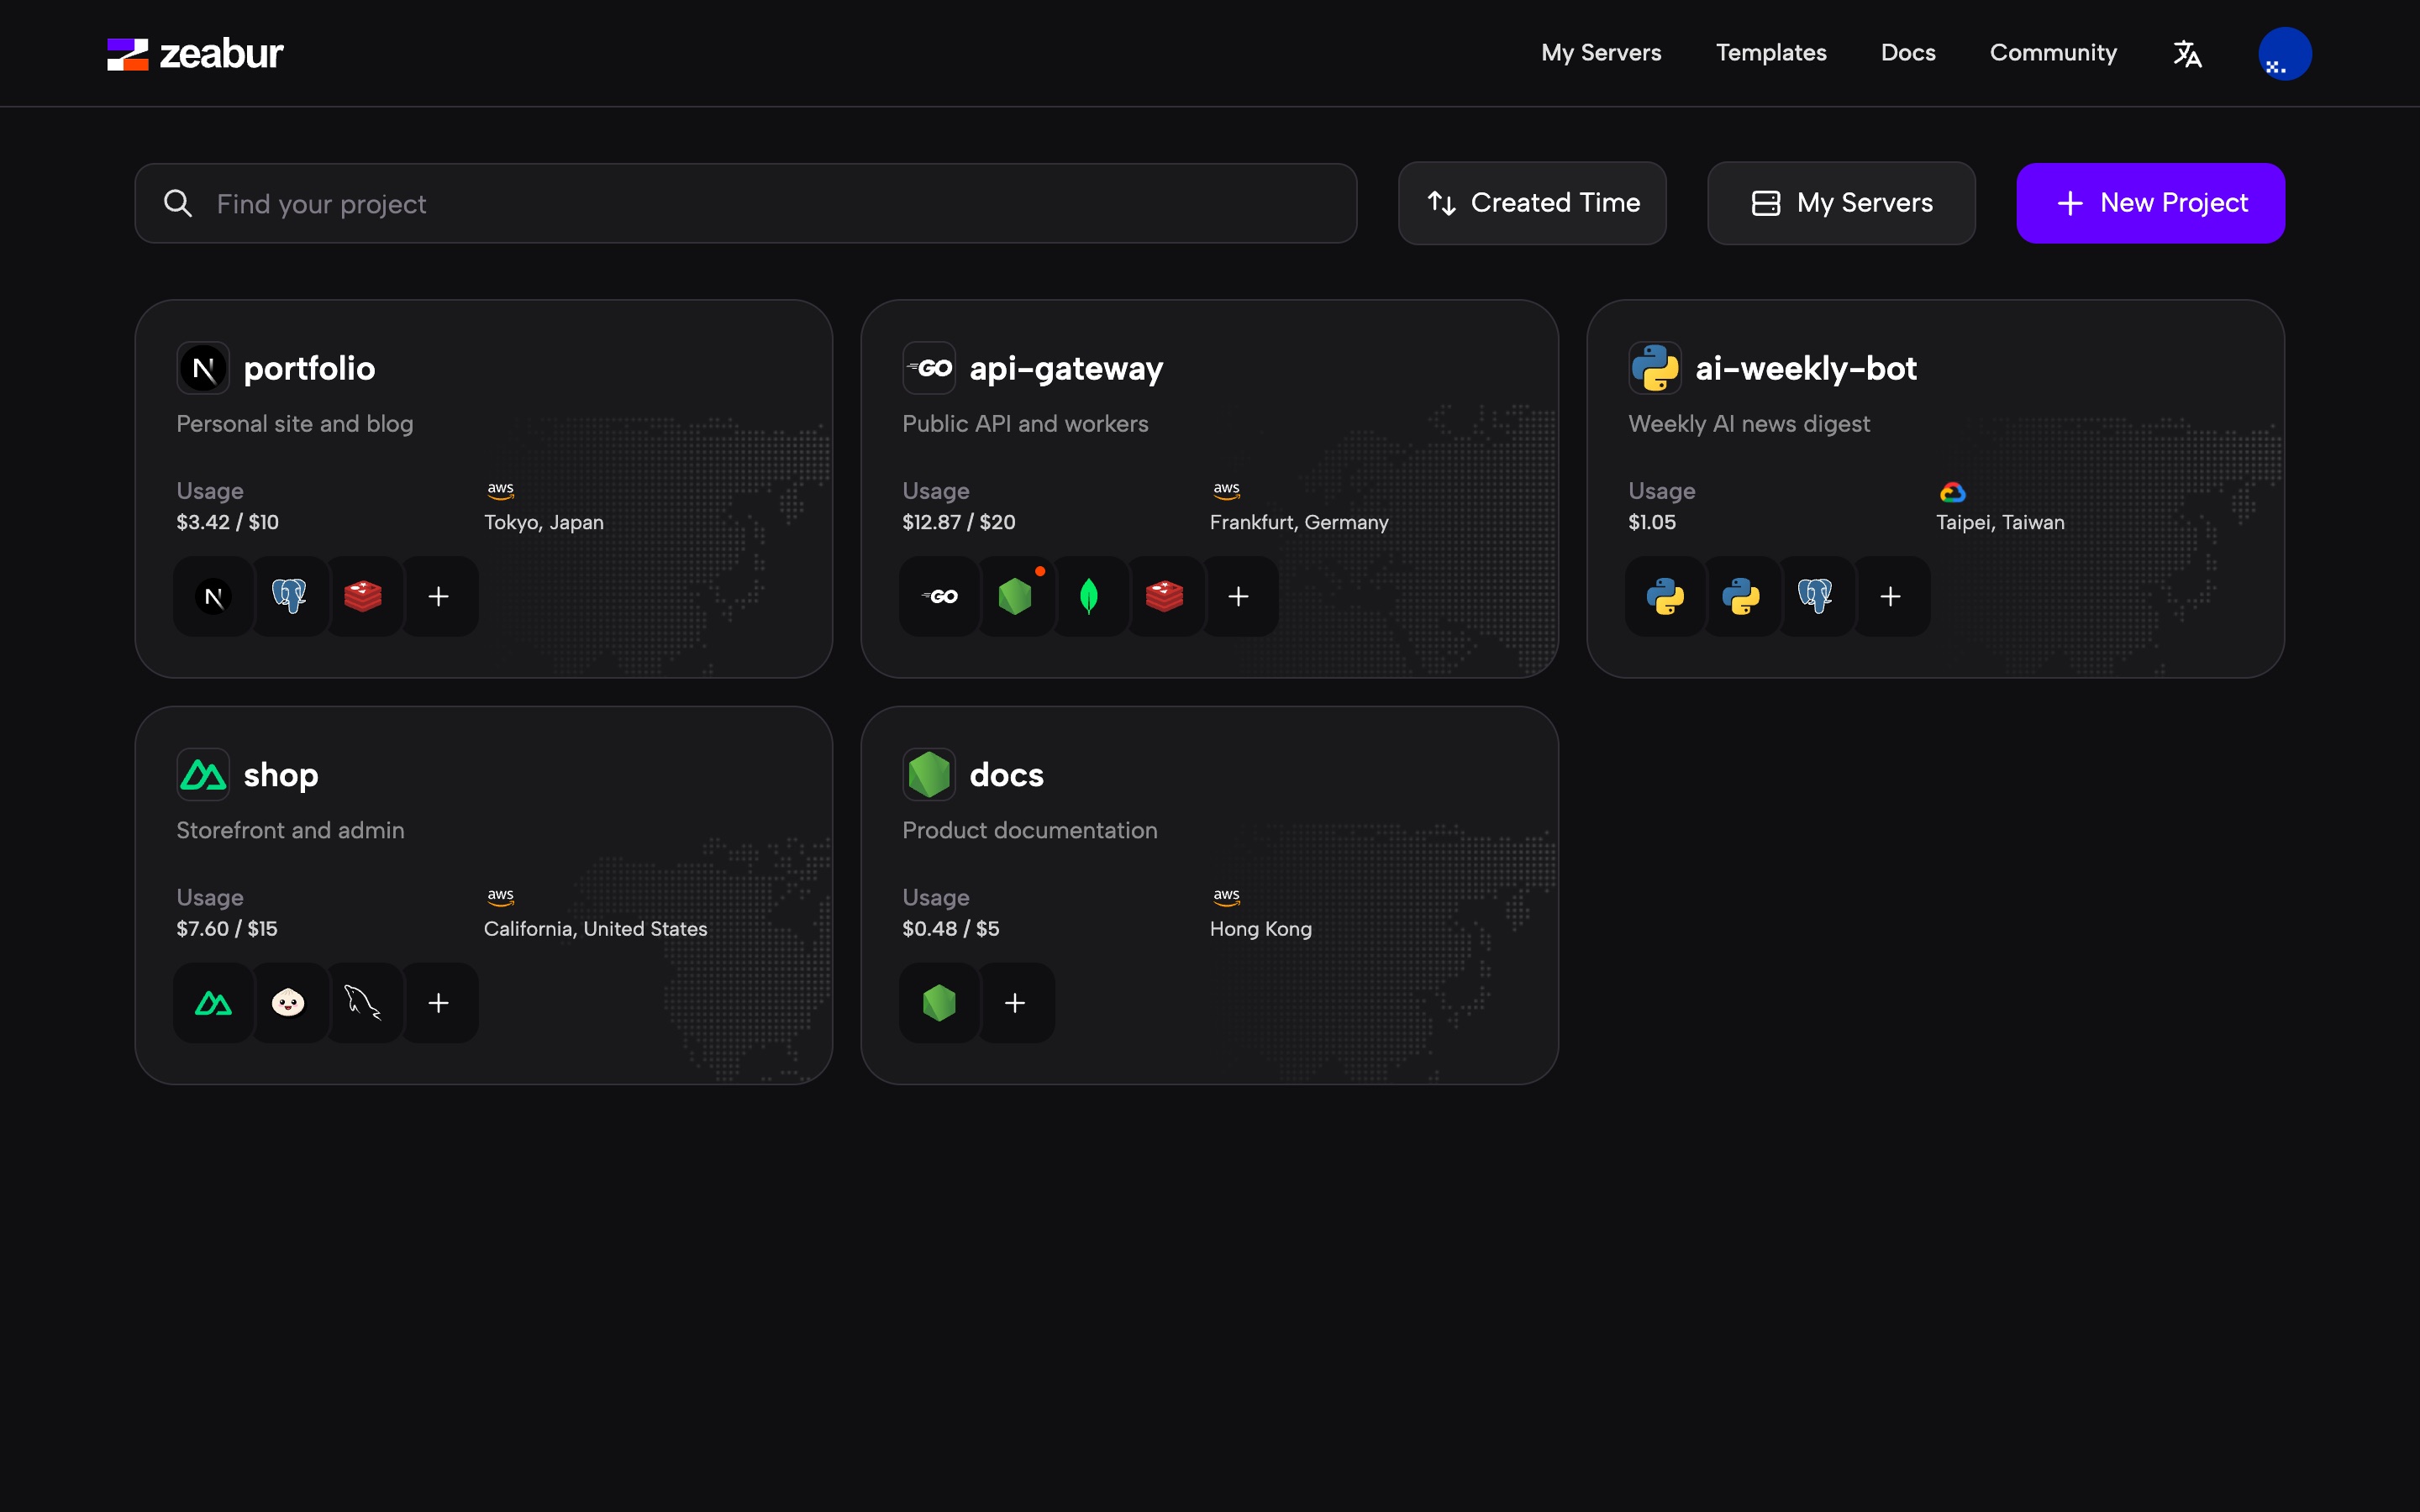
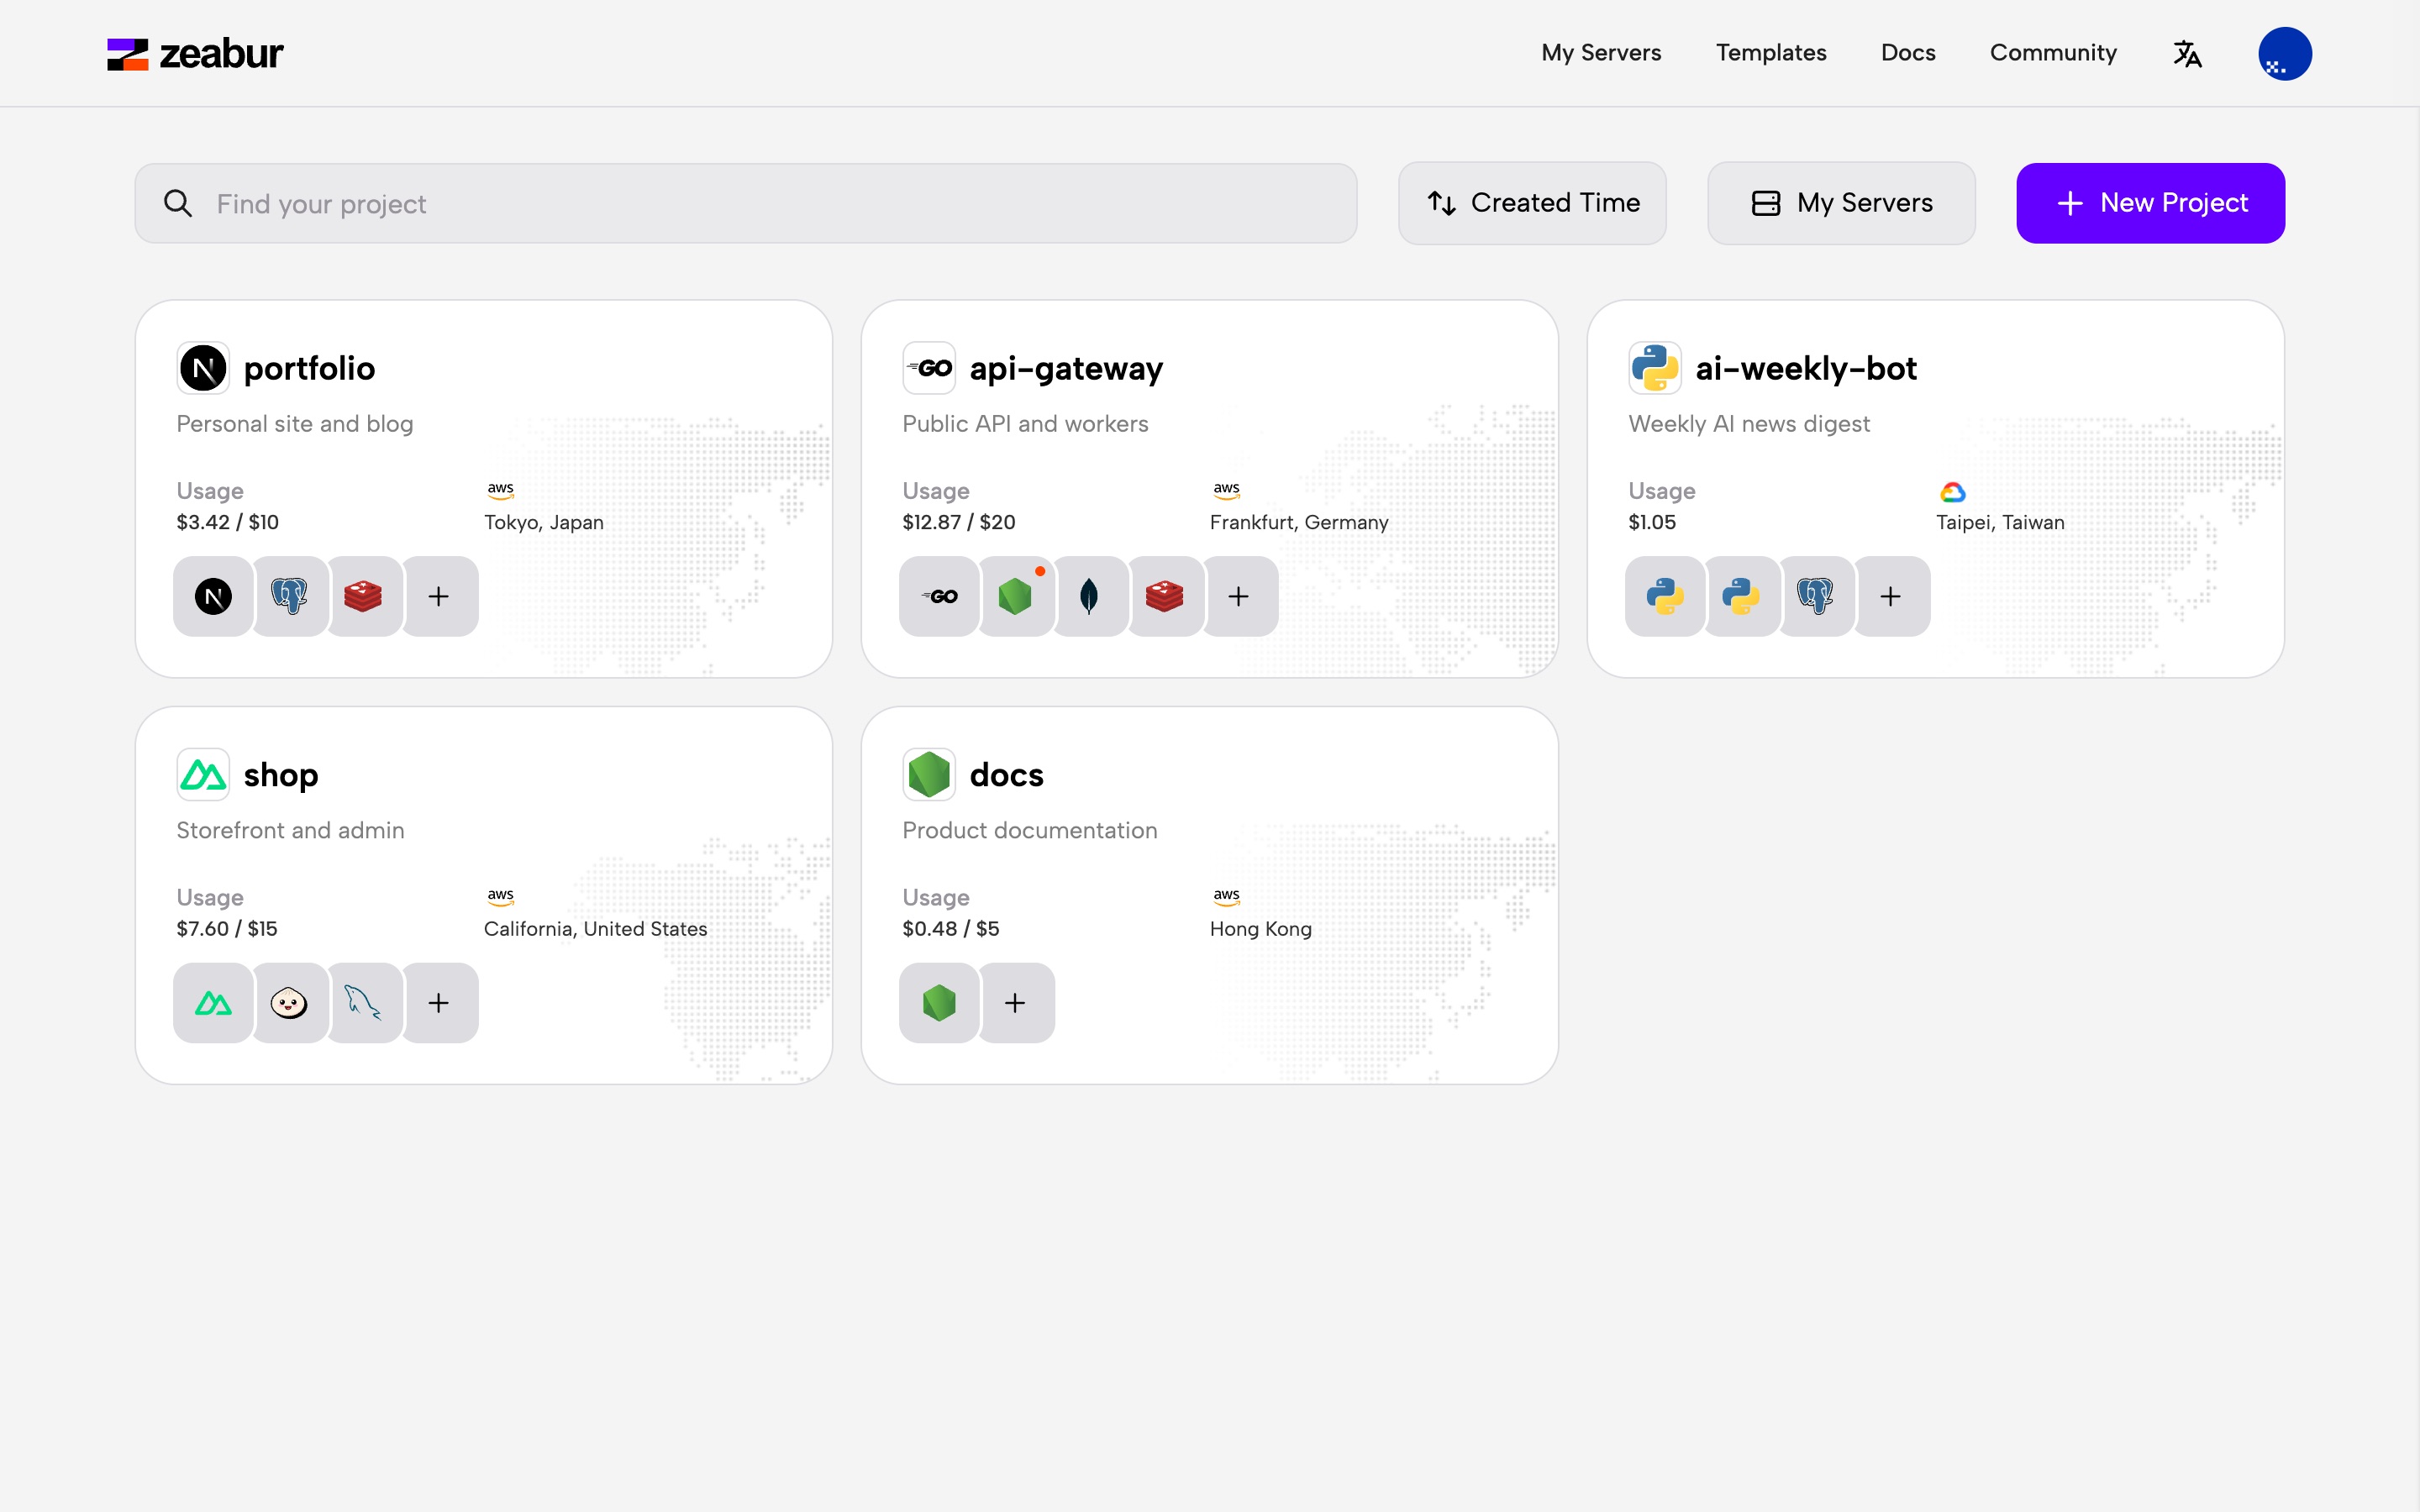
I redefined the card as a summary of the project's status, keeping only the region, current usage and service health. Health doesn't take up its own row: a red dot appears on a service's icon only when it crashes or a deployment fails. When a project is healthy, the card shows no status at all.
Five changes on the home page: the create button moves into the toolbar, four columns become three, cards show usage and region, empty slots are removed, and a red dot appears only on failure
Project details used to be a drawer panel over the home page, with deployments, environment variables, metrics and networking stacked as collapsible sections. As backups, volumes and database management were added, the sections grew longer and the panel ran out of room.
The redesign turned project details into a standalone page: a fixed sidebar on the left for project and service navigation, and tabs on the right for the active service's modules. I owned the visual style, top navigation bar and project sidebar, and built the first batch of base components along the way.
Five changes in project details: the panel becomes a standalone page, the sidebar becomes project navigation, service info folds into a single title row, collapsible sections become tabs, and the overview splits into four kinds of cards for status, deployments, domains and tools
Beyond the shared cluster, users can connect their own servers or buy a managed VPS from Zeabur. Carrying over the "status summary" approach from the home page, cards in the server list show only the provider, IP, region, and CPU and memory usage, so users can gauge load at a glance without opening details.
The server list, the details modal, and the flows for connecting your own server and buying a managed VPS; all data is sample data
The dashboard originally had no systematic design guidelines: colors came straight from Tailwind's raw scales, and empty states and error pages used generic stock art. I rebuilt the palette and semantic tokens, put together a set of reusable base components, and designed an illustration system for the dashboard and website.
Light mode was a frequent request from the community, while dark mode itself suffered from low contrast. Because the codebase referenced raw Tailwind scales directly (such as purple-600) and the old palette was built for dark mode only with uneven lightness steps, swapping scales alone could not produce a usable light mode. I initiated and led a rebuild of the color system.
base
violet
orangered
The old palette: the gray base was designed for dark only, with lightness dropping 0.17 in one step from 400 to 500; the purple and orange-red were generated in HSL, and the orange-red's 950 still had a lightness of 0.54, barely darkening at the deep end
Working in the OKLCH color space with Huetone, I hand-picked three new scales—gray, purple and orange-red (for how OKLCH works, see this post). Because gray carries the most hierarchy, I added four half steps (150, 250, 750 and 850) between the standard ones for 15 steps in total; in code, colors are stored as RGB triplets in CSS variables to keep Tailwind's opacity syntax working.
zGray
zViolet
zOrangered
Values taken from the dashboard code; gray has two half steps at each of the light and dark ends. When comparing, each new scale has the old scale it replaces below it
High-frequency text colors are abstracted into three semantic tokens (main, secondary and tertiary), while backgrounds and borders define only a handful of semantic variables and everything else continues using raw scales, keeping the semantic layer from bloating in a fast-moving product. See the full comparison in the light mode changelog.
text-main white
text-secondary 300
text-tertiary 500
border 800
background 950
Layout and components stay the same; only the scales the semantic tokens point to change
I brought HeadlessUI v2 into the dashboard and rewrote atomic components including Button, Menu, Listbox, Input, Modal, Switch, Checkbox and Tooltip. Structured after shadcn/ui, the library holds only base primitives and avoids wrapping business components like ServiceCard—while product features are still evolving, business wrappers go stale quickly.
Rebuilt with the styles and tokens from the dashboard code, and fully interactive; switching between dark and light only changes the token values
The 404, 502 and empty state pages previously used generic stock art. Drawing on my industrial design background, I modeled forms in Rhino, exported their outlines and animated them in Lottie to create a wireframe isometric style—letting the CAD software guarantee consistent perspective and line weight, fitting the technical feel of a developer tool. This visual language later extended to dashboard modals and website landing pages.
git push, framework detected, website online: in the feature section, three cubes light up in turn as code goes from push to framework detection to a live site
The three ways to deploy on the landing page: shared cluster, your own server and managed VPS
By the time I left, 89 of the dashboard's 184 TSX files used these base components, and the new scales and semantic tokens covered most pages.
107
Files using the new scales
140
Files using semantic text tokens
89
Files using base components
Lowercase letters, numbers and hyphens.
404
502
Server
Download